
Meta Description:
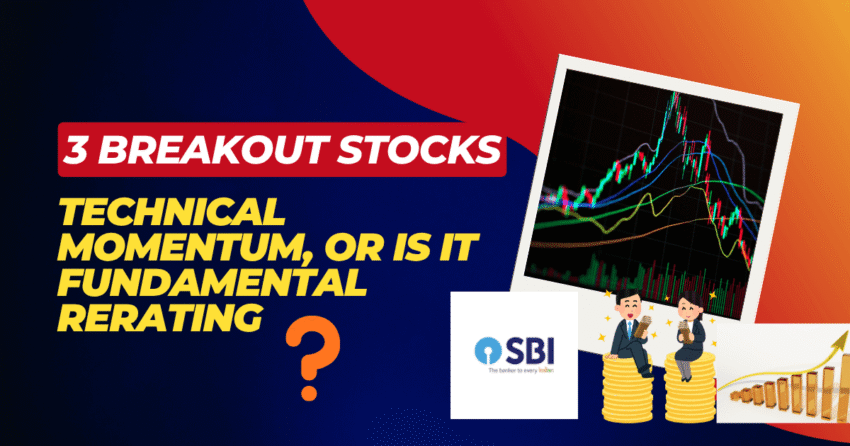
3 Breakout Stocks: Discover if the recent breakouts in GK India, Hindalco, and SBI are backed by real fundamentals or just short-term market momentum. A detailed analysis of charts, earnings, and future growth potential.
3 Breakout Stocks: GK India, Hindalco & SBI — Are These Just Chart Moves or Real Reratings?
📈 Introduction: When a Breakout is More Than Just a Chart Pattern
In the stock market, a breakout on the chart often signals strength — but what kind of strength?
Is it purely technical momentum, or is it fundamental rerating based on improving business performance?
Today, we analyze three breakout stocks — GK India, Hindalco Industries, and State Bank of India (SBI) — to see whether their price moves are short-lived rallies or signals of something deeper.
Each of these stocks has recently broken key resistance levels, attracting attention from both traders and investors. But beneath those technical patterns, their financial performance, efficiency ratios, and future growth drivers reveal whether these are sustainable trends.
🚀 1. GK India: Breakout from a Year-Long Consolidation
Chart & Technical Setup
GK India (Goodluck India Ltd.) has just delivered a weekly breakout to an all-time high, ending an 18-month consolidation phase.
The ₹1,250 level acted as a strong resistance multiple times, but last week, the stock decisively broke above it.
⚠️ Trend Invalid Below ₹1,050
If the stock closes below ₹1,050, this breakout pattern could fail — but as long as it stays above, the momentum remains strong.
Business Overview
Goodluck India manufactures value-added steel products such as:
- Precision ERW/CDW tubes
- Engineered structures
- Custom fittings used in auto, infrastructure, and oil & gas sectors
This positions the company between commodity pipe producers and premium stainless steel manufacturers, offering both diversification and pricing power.
Industry Tailwinds
With India’s infrastructure, renewables, and defense capex rising, the steel and metal fabrication sector has seen renewed investor confidence. The recent India rating upgrade by S&P has also strengthened sentiment across the materials segment.
Financial Highlights
| Metric | FY26 Q1 | YoY Growth |
|---|---|---|
| Revenue | ₹983 Cr | +7.7% |
| Operating Profit | ₹92 Cr | +22.7% |
| Operating Margin | 9.36% | ↑ 300 bps |
| Net Profit | ₹40 Cr | +11% |
| CFO/Net Profit Ratio | 95x | ↑ from 74x |
Strong volume growth (+11%) and margin expansion from 6% to 9% indicate improved cost efficiency — raw material costs dropped from 72% to 69% of sales.
Balance Sheet & Efficiency
- Interest coverage: up from 2.8× to 3.7×
- Fixed asset turnover: slightly declining (due to new capacity ramp-up)
- Cash flows: turned positive in FY25 after two years of decline
Growth Outlook
The company commissioned a new hydraulic tubes plant in January 2025, currently at 50% utilization, with a target of 70% by FY26.
At full capacity, this plant could add ₹1,200–1,300 Cr in annual revenue.
The solar structures segment (now 24% of revenue) doubled YoY in Q1 and is expected to maintain momentum.
Management is guiding for 15–20% revenue growth and margin expansion in FY26, led by:
- Defense vertical ramp-up (expected ₹270 Cr revenue by FY27)
- Margin-rich products with 25–35% EBITDA potential
Risks
- Efficiency pressure from falling turnover ratio
- Dependence on defense and government approvals for license clearances
Verdict:
GK India’s breakout appears technically solid and fundamentally justified. The combination of diversification, margin expansion, and capex execution supports a medium-term rerating case.
🏗️ 2. Hindalco Industries: Breaking New Highs Amid Commodity Cycles
Chart & Technical Setup
Hindalco recently broke above ₹765, hitting a new lifetime high after months of consolidation.
⚠️ Trend invalid below ₹730
The metal sector has seen steady inflows, and Hindalco, a key Nifty Metals component, is among its strongest performers.
Business Overview
Hindalco is an integrated aluminum and copper producer — controlling the full chain from mining to finished goods.
Its global subsidiary, Novelis Inc., is the world’s largest aluminum recycler, contributing about 59% of revenue.
Product-wise revenue mix:
- Aluminum (Novelis): 59%
- Copper: 22%
- Others (India operations): 19%
Financial Highlights (Q1 FY26)
| Metric | Value | Change |
|---|---|---|
| Revenue | ₹64,232 Cr | +13% YoY |
| Operating Margin | 12% | ↓ from 13% |
| Other Income | ₹64 Cr | +529% YoY |
| Cash Balance | ₹18,000 Cr | – |
| Net Profit | ₹3,500+ Cr | +31% YoY |
While margins softened slightly due to global tariff pressures on Novelis, the company offset it through better asset utilization and strong domestic demand.
Growth Outlook
- Investing $1 billion over 5 years to expand capacity and recycling operations.
- Captive coal mines to reduce costs by 30% within two years.
- Ongoing copper & e-waste recycling plant in Gujarat to be operational by FY27.
Hindalco’s strong liquidity (₹18,000 Cr cash) allows it to fund growth without leveraging aggressively.
Risks
- Commodity price fluctuations in aluminum and copper.
- Global slowdown in auto, construction, or packaging sectors.
- Temporary pressure on cash flow conversion (CFO ratio down 21%).
Verdict:
Hindalco’s breakout is supported by robust global positioning and efficient capital allocation, even as cyclical risks persist. It’s a case of sustainable strength, not just momentum.
🏦 3. State Bank of India (SBI): Breakout Reflects Banking Strength
Chart & Technical Setup
SBI recently broke out of its downward channel, crossing above ₹840 — its highest ever.
⚠️ Trend invalid below ₹820
After months of consolidation, PSU banks are showing renewed strength, and SBI is leading the rally.
Financial Highlights (FY26)
| Metric | Value | YoY Growth |
|---|---|---|
| Total Income | ₹1,66,992 Cr | +9.7% |
| Other Income | ₹41,263 Cr | +21.9% |
| Consolidated Net Profit | ₹21,627 Cr | +9.9% |
| Cost-to-Income Ratio | 47% | ↓ from 49% |
| NIM | 2.9% | ↓ 32 bps |
The improvement in cost efficiency and stable net profit growth indicate strong operational control even with rising deposit costs.
Balance Sheet Health
- Credit growth: 11.06% YoY
- Deposit growth: 11.1%
- CRAR: 15.33% (up from 14.63%)
- Gross NPAs: down to 2.47%
- Net NPAs: down to 0.47%
SBI’s risk absorption and solvency remain among the best in the sector.
Growth Outlook
- Sanctioned & pipeline loans: ₹7.2 lakh crore (~17% of total advances)
- Corporate credit growth: Expected double-digit from Q2 FY26
- Overall bank credit growth: 12% guidance
- Domestic NIM: To remain around 3%
Risks
- Rising cost of deposits (now 5.21%, increasing each quarter)
- Short-term credit demand volatility due to prepayments or market shifts
Verdict:
SBI’s breakout isn’t just technical — it’s backed by sustained earnings, improving efficiency, and strong solvency. It remains a structural compounder among PSU banks.
⚙️ Summary: Are These Breakouts for Real?
| Stock | Breakout Type | Support Zone | Fundamentals | Outlook |
|---|---|---|---|---|
| GK India | Multi-year high | ₹1,050 | Strong margin expansion, defense diversification | Positive |
| Hindalco | All-time high | ₹730 | Global diversification, steady earnings | Moderately Positive |
| SBI | Channel breakout | ₹820 | High capital efficiency, strong growth guidance | Strong |
💡 Investor Takeaway
Breakouts alone can’t predict success — but when price and fundamentals align, they create some of the best multi-year opportunities.
- GK India represents industrial expansion with niche steel leadership.
- Hindalco blends commodity exposure with sustainability and recycling scale.
- SBI is the benchmark of stability and consistent profitability in PSU banking.
Traders can track key levels (₹1,250 / ₹765 / ₹840) for continuation, while long-term investors may treat these as accumulation zones on dips.
🔍 SEO FAQ
Q1: What does a stock breakout mean?
A breakout occurs when a stock’s price moves above a key resistance level, often indicating the start of a new trend or momentum phase.
Q2: Is GK India’s breakout sustainable?
Yes, it appears supported by improving margins, capacity expansion, and new product lines in solar and defense.
Q3: What is driving Hindalco’s all-time high?
Strong aluminum demand, cost efficiency, and investments in recycling capacity have strengthened its global positioning.
Q4: Why is SBI stock making new highs?
SBI’s robust profitability, capital adequacy, and consistent credit growth underpin its breakout beyond ₹840.
Q5: Should investors buy after a breakout?
Only if the breakout is confirmed by volume and backed by strong fundamentals. Otherwise, wait for retests or consolidations.
🧭 Conclusion
The recent breakouts in GK India, Hindalco, and SBI may be more than mere technical spikes.
Each company reflects improving business fundamentals, sectoral strength, and earnings visibility — turning technical rallies into potentially long-term reratings.
As always, investors should track trend validity levels and business performance together.
Because the best breakouts are the ones that happen both — on charts and in earnings.
Disclaimer: This article is for educational purposes only and should not be considered financial advice.As always, do your own due diligence and consult a financial advisor before investing.
Investment in securities markets is subject to market risks. Please read all related documents carefully before investing.
ALSO READ
Follow me on Twitter (X) or Facebook Group for Updates.
Liked our article ? Subscribe to get weekly updates