
W Pattern For Momentum Trading: A Winning Strategy for Stock Market Trading
Discover the power of the W pattern—a time-tested approach to identifying market reversals and spotting opportunities in momentum stocks. Whether you’re new to trading or looking to refine your strategies, this guide will walk you through recognizing the W pattern, leveraging it effectively, and pairing it with fundamental insights for optimal results.
What is the W Pattern For Momentum Trading?
The W pattern is a classic stock market chart pattern resembling the letter “W.” It’s a reliable indicator of a potential trend reversal and is especially useful when trading momentum stocks.
This pattern forms over a timeframe of up to four months, with quicker formations yielding better results. If a W pattern takes more than six months to form, it’s generally less effective.
Key Features of the W Pattern
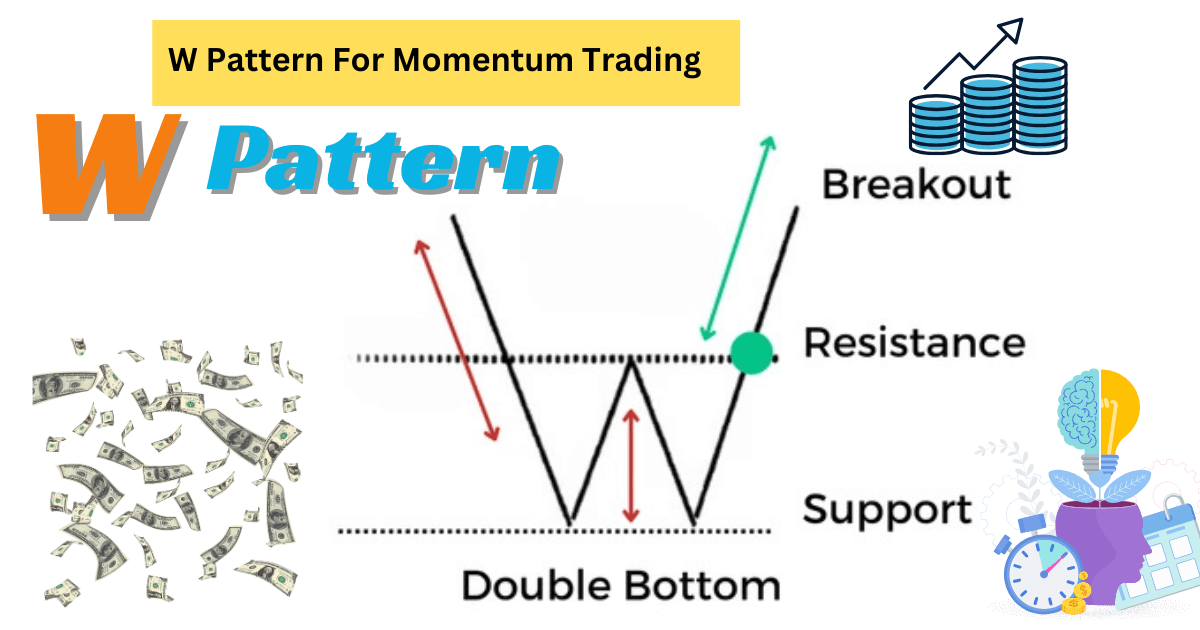
- Double Bottom: Two low points at nearly the same level.
- Resistance Breakout: A rise above the mid-point resistance completes the pattern.
- Clean Breakout: A confirmed breakout with clear upward momentum signals an entry point.
Anatomy of the W Pattern
A W pattern forms through these stages:
- First Fall: The price drops significantly, creating a bottom.
- First Rise: The price recovers partially.
- Second Fall: The price falls again, usually to the same level as the first bottom, creating a double bottom.
- Final Rise: The price rises again, breaking the resistance formed at the mid-point of the W.
The pattern is complete once the price breaks the resistance and achieves a clean breakout. A clean breakout means the closing price is significantly above the resistance level, leaving no doubt about the breakout.
How to Trade the W Pattern in Stocks
Step 1: Identify the Pattern
- Look for a sharp price fall, partial recovery, a second drop to the same level (double bottom), and a subsequent rise.
- Ensure the second low forms within a similar range as the first low.
Step 2: Wait for a Breakout
- Watch for the stock price to break through the mid-point resistance of the W.
- The breakout should occur with a strong green candle for clarity.
Step 3: Confirm the Breakout
- Confirmation is critical. The price must trade above the breakout candle’s high, even intraday.
Step 4: Set Targets
- Technical Target: Measure the depth of the W (from the bottom to the resistance) and project it upward from the breakout point.
- Alternative Target: Aim for the highest closing price from the fall’s origin.

Real-Life Example: Punjab National Bank (PNB)
In PNB’s chart:
- The price fell, recovered, and fell again to form a double bottom.
- It broke the mid-point resistance with a strong green candle, confirming the breakout.
- The target was the highest closing price from the fall, which was achieved swiftly.
Fundamental Check
PNB showcased stellar financials, including record profits and increased institutional holdings. Combining this fundamental strength with the technical pattern validated the trade opportunity.
Trading Tips for the W Pattern For Momentum Trading
- Avoid Doubtful Patterns: If the breakout isn’t clear, skip the trade. Only act on well-defined patterns.
- Always Confirm Breakouts: The price must exceed the breakout candle’s high before entering a trade.
- Backtest Patterns: Analyze past charts to understand how W patterns behave in your chosen stocks.
- Combine Technicals and Fundamentals: A strong chart pattern backed by solid fundamentals increases success probabilities.
Other Examples of W Pattern For Momentum Trading

Example: Samman Capital
- Formation: The price fell, recovered, dropped again to a similar level, and started rising.
- Breakout: A breakout occurred, confirmed by the price exceeding the breakout candle’s high.
- Target: The target was the highest closing price from the initial fall, which was achieved within two weeks, yielding an 11% return.
Practice Makes Perfect
Trading the W Pattern For Momentum Trading successfully demands practice, patience, and persistence—much like planting a mango orchard, where the effort invested early yields fruitful rewards over time.
How to Find W Patterns in Charts
- Use tools like screener.in or trading platforms with robust charting features.
- Monitor stocks for potential double bottom patterns forming within a few months.
Conclusion
The W Pattern For Momentum Trading is a powerful way to identify and trade stocks with momentum. By combining technical analysis with fundamental strength, you can improve your success rate and achieve consistent returns.
Start practicing today, and don’t forget—success in stock trading requires dedication and continuous learning. Happy trading!
ALSO READ
Liked our article ? Subscribe to get weekly updates